Results
The output is shown in two sections:
- Interactions: This section contains a table containing the SMILES, 2D representation, and their identified interactions as shown in Figure 2. The rows can be filtered based on any of the column attributes.
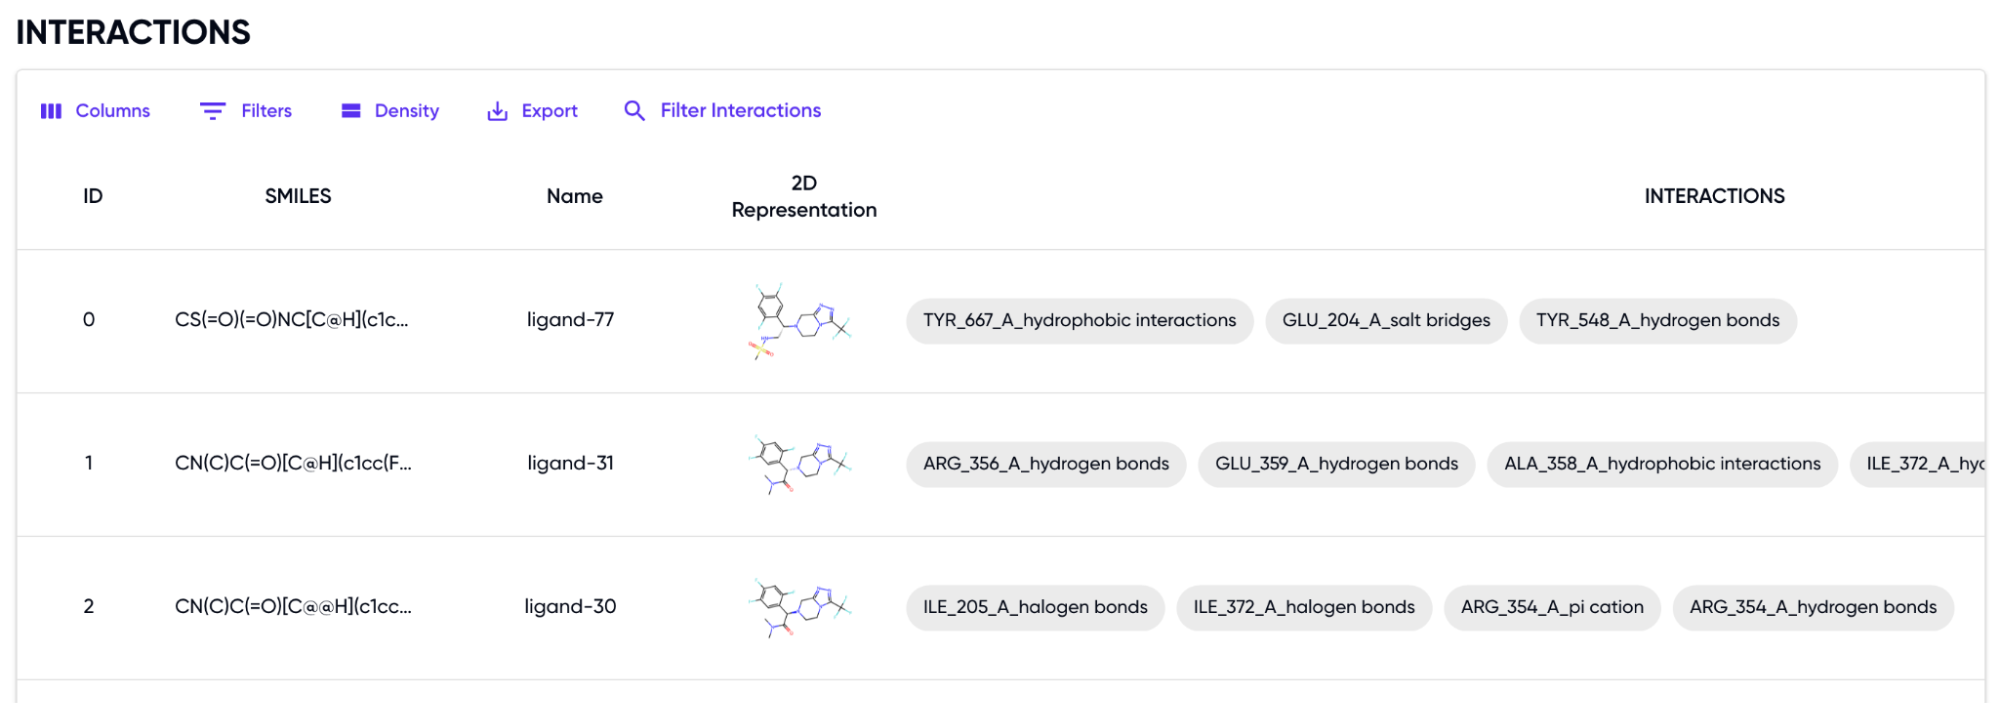
Figure 2: Table of Interactions of the input set of SMILES with the protein
For interaction-based filtering, two formats are available (refer to Figure 3) –
(1) by selecting from a dropdown of known interactions in the output
(2) by manually entering the interaction type, residue number, name, and chain
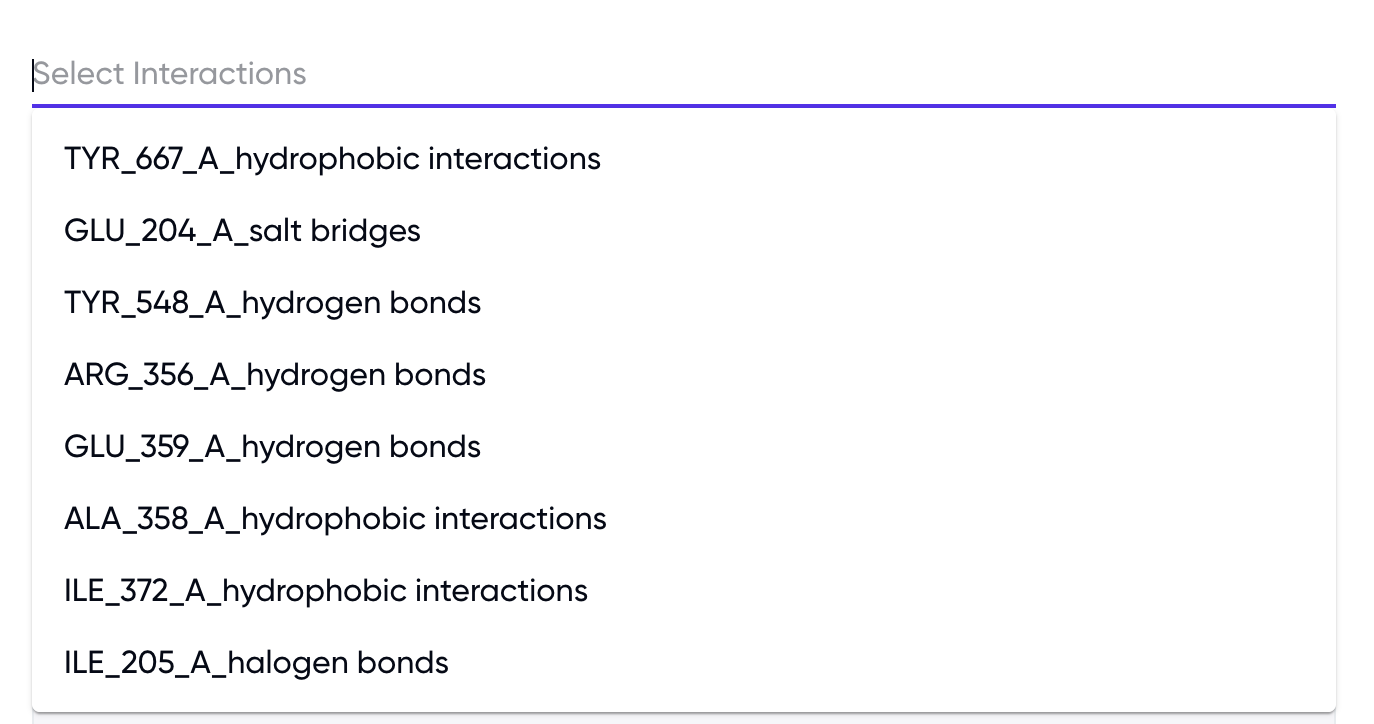
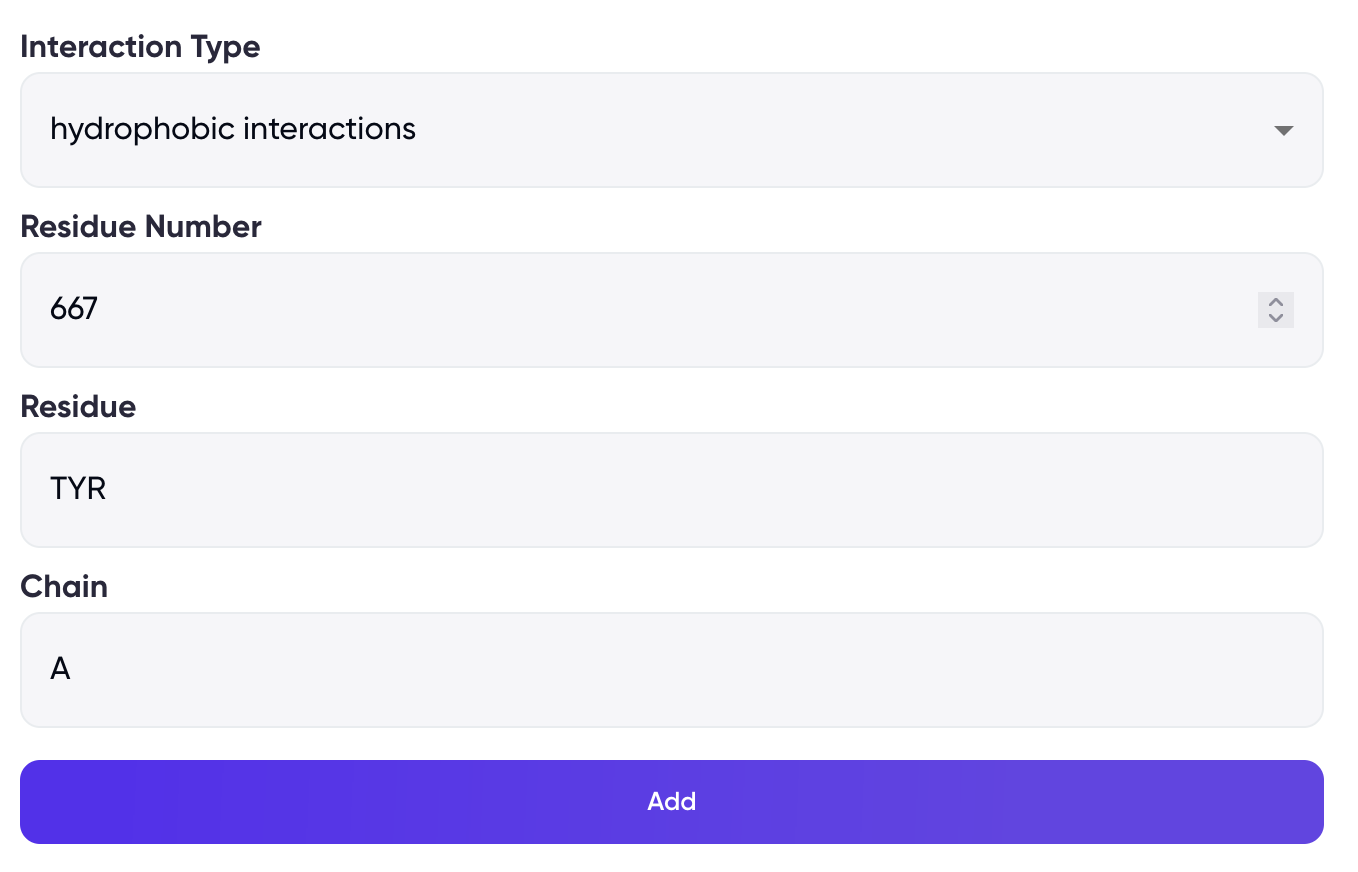
Figure 3: Selection of desired interactions using the “Filter Interactions” option
After selecting the interactions, the filtered table is shown, with the chosen filters highlighted in green (Figure 4):
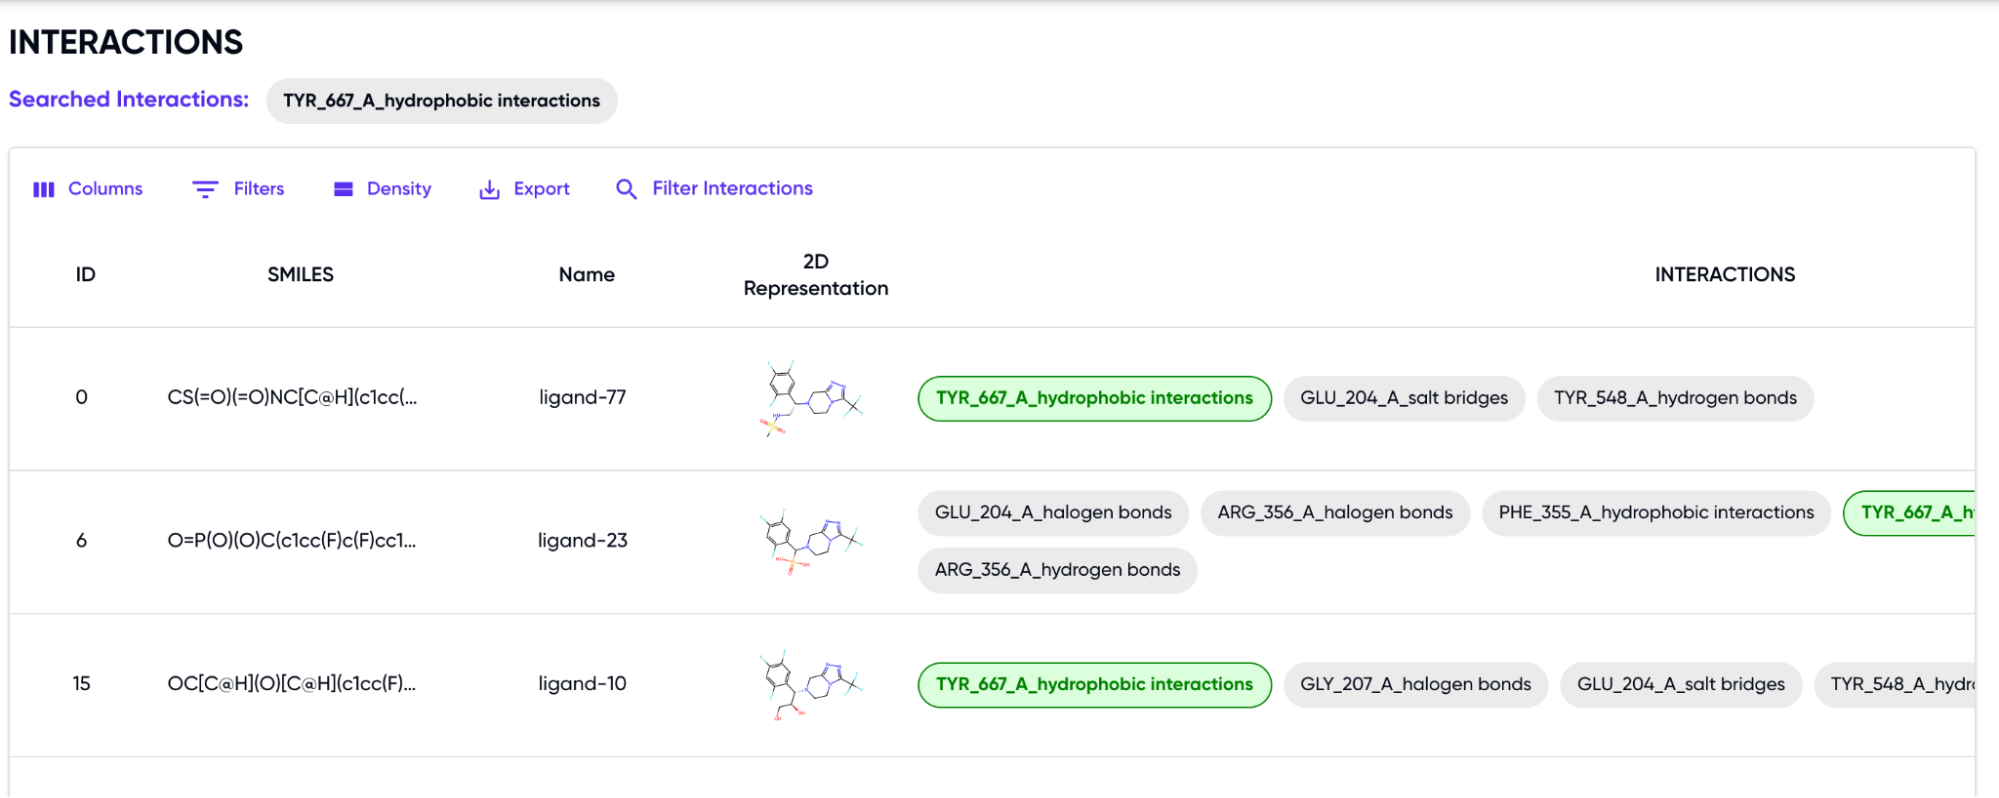
Figure 4: Filtered Output with highlighted interactions
- Conserved Signature: This table lists the interactions that are common across all ligands, i.e. each input ligand shows the given interactions with the protein, as shown in Figure 5.
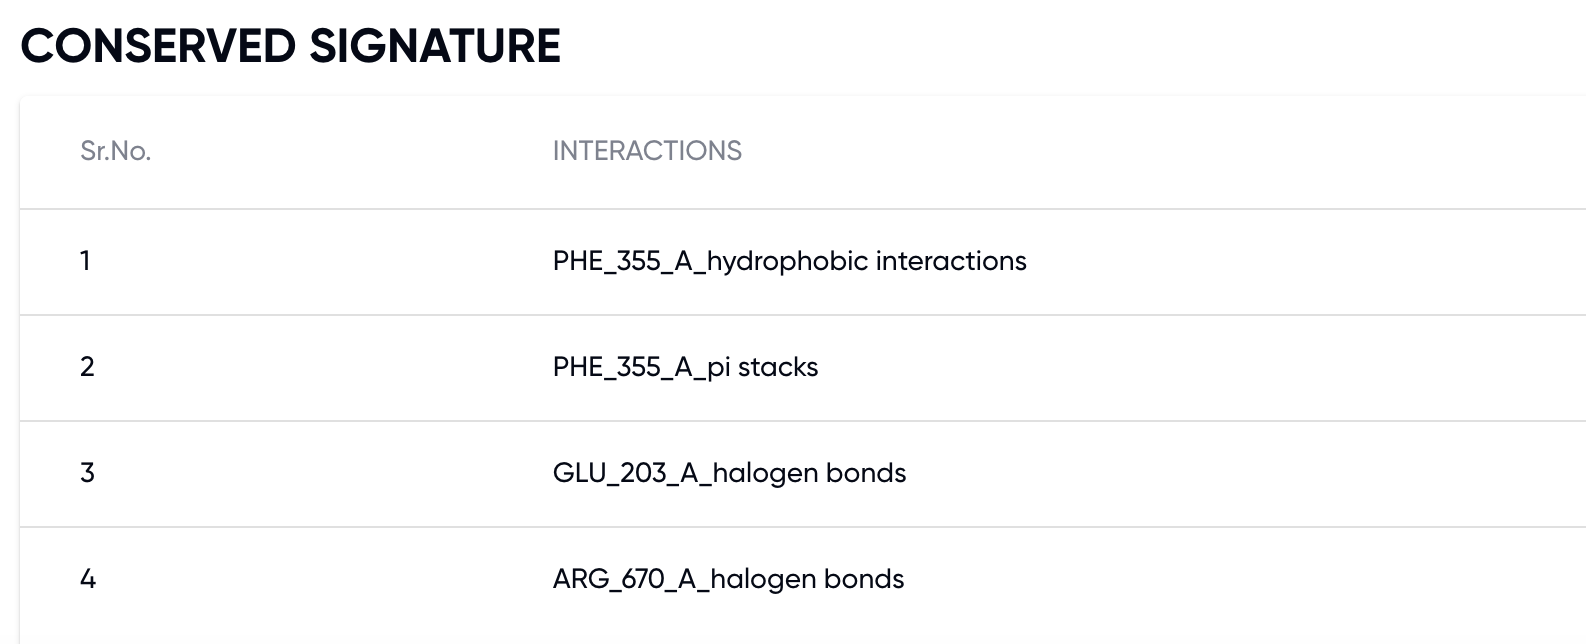
Figure 5: Example of Conserved Signature obtained in LIFT Filter